Elon Musk is the planet’s number one billionaire. If anyone can turn cyberspace into a heaven – or hell – of free speech “absolutism” via a US$44 billion (£35 billion) Twitter takeover, then surely he’s the man. Right? When free-market elephants like Musk or Jeff Bezos (who bought the Washington Post in 2013) take charge...
Tag: twitter

What Elon Musk’s US$3 billion Twitter deal means for him – and for social media
The world’s richest man, Elon Musk, is now the largest shareholder of Twitter after acquiring a 9.2% stake in the social media platform for just under US$3 billion (£2.3 billion). The announcement drove Twitter’s share price up 27%, and it continued to grow in after-hours trading. This investor enthusiasm is not surprising. Social media platforms...
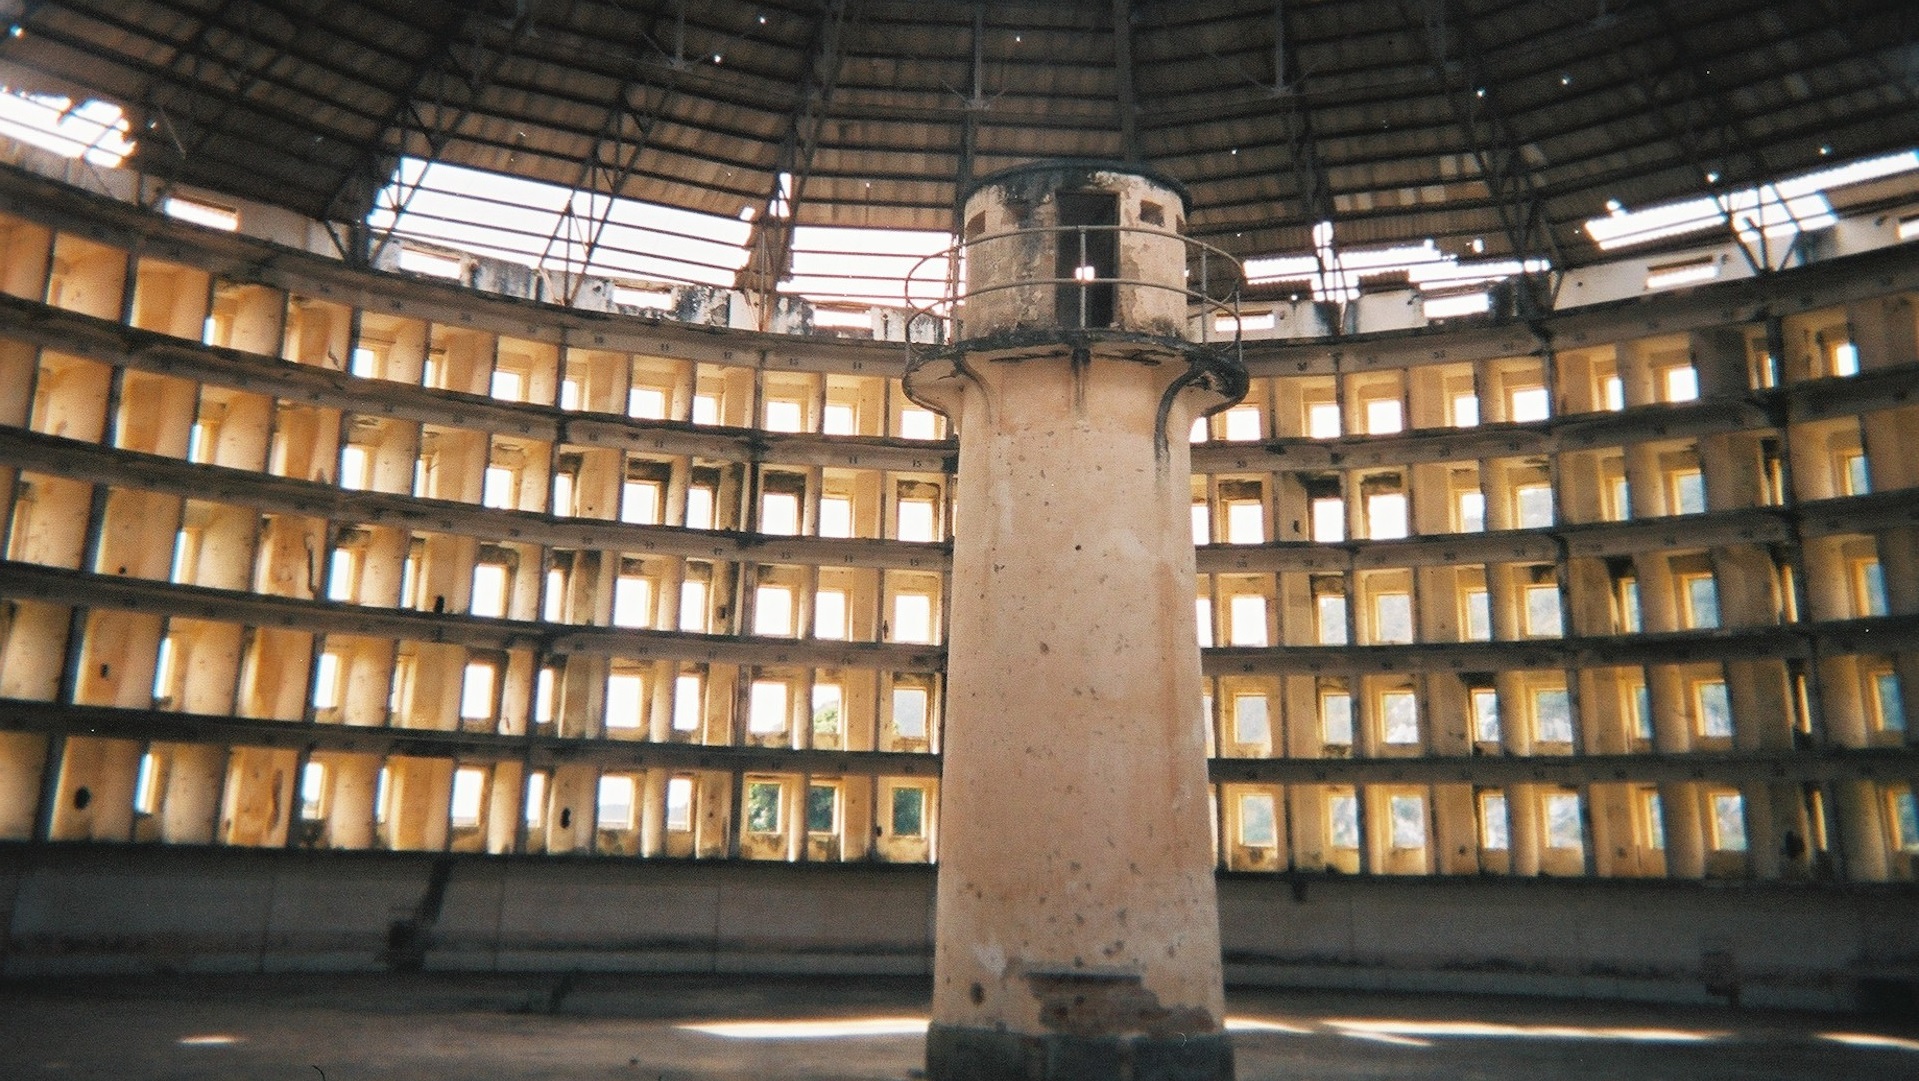
The Twitter Surveillance State
When Justine Sacco, who in 2013, before a flight to South Africa, tweeted a joke about getting AIDS on Twitter it blew up, as did her life.

Super apps – The platform for the post-app era
The world’s largest social media companies could evolve into super apps over the next few years. They will be able to facilitate a greater number of online activities. Although they were initially created to keep friends and family in touch or entertain, social media networks like Facebook, Snap, TikTok and others will be increasingly important...
Apple’s app tracking popup reportedly costs social media platforms nearly $10 billion
A report by the Financial Times showed that Snapchat, Facebook and Twitter lost approximately $9.85 billion in revenue due to Apple’s privacy changes. Apple last year announced the App Tracking transparency (ATT) policy, which requires that apps ask permission to track users. In April this year, the policy was finally implemented. Apps can no longer...
Can “Indie” Social Media Save Us? | The New Yorker
Cal Newport on Indie alternatives to existing social media platforms: At the end of my TEDx talk, I note that people often ask me what life is like without social media. By way of an answer, I project a photograph of a bench overlooking a quiet pastoral landscape. As a technology enthusiast, I’m a believer...

Können “Indie” Plattformen Social Media retten? | The New Yorker
Cal Newport zu Indie Alternativen zu bestehenden Social Media Plattformen: Am Ende meines TEDx-Vortrags stelle ich fest, dass die Leute mich oft fragen, wie das Leben ohne soziale Medien ist. Als Antwort projiziere ich ein Foto einer Bank mit Blick auf eine ruhige pastorale Landschaft. Als Technologie-Enthusiast glaube ich an die IndieWeb-Bewegung und denke, dass...
